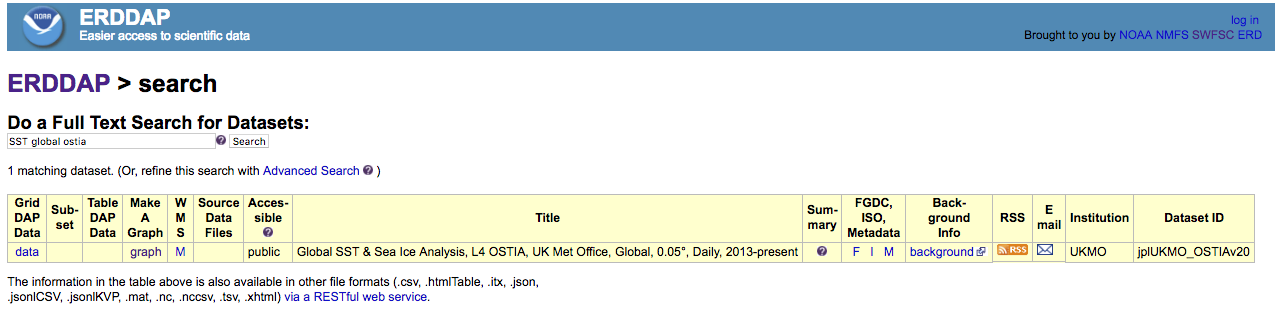
ERDDAP Basics - Using the ERDDAP data catalog
Learn how to navigate the ERDDAP data catalog to discover datasets of interest. This tutorial walks through browsing available datasets, using full-text search to refine results, and examining dataset summaries and metadata to evaluate spatial coverage, resolution, time range, and data provenance.
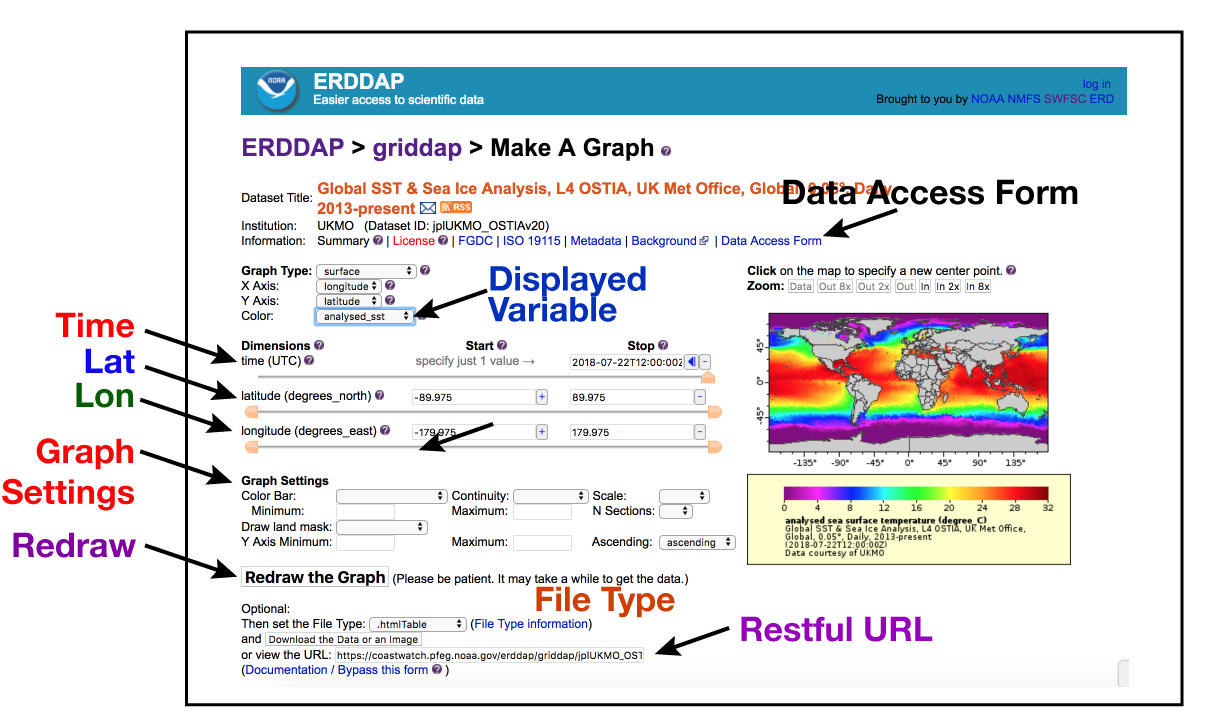
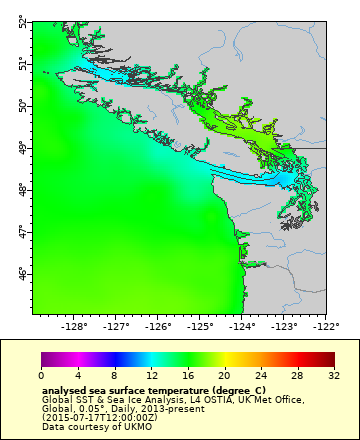
ERDDAP Basics - Visualize and download data
This tutorial demonstrates how to use ERDDAP’s Make A Graph feature to visualize gridded data, subset by time and region, customize map appearance, and download results in common image and data formats. Users learn how to generate reproducible URLs for sharing or importing data directly into analysis tools such as Python, R, or Matlab.
ERDDAP Basics - Understanding the ERDDAP URL
This tutorial explains how ERDDAP data requests are fully defined within a URL and how those URLs can be edited to control dataset selection, spatial and temporal subsetting, output formats, and visualization settings. You will learn how to modify URL components by hand to retrieve different maps, images, and data files, including accessing the most recent available data. The tutorial concludes by showing how ERDDAP URLs can be generated and used within scripts to automate data downloads and integrate ERDDAP directly into analysis workflows.
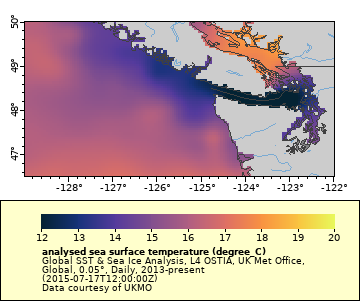
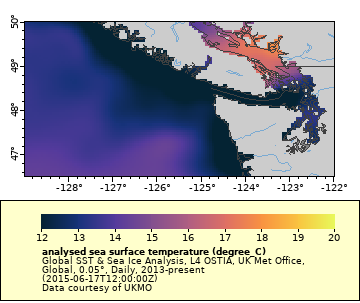
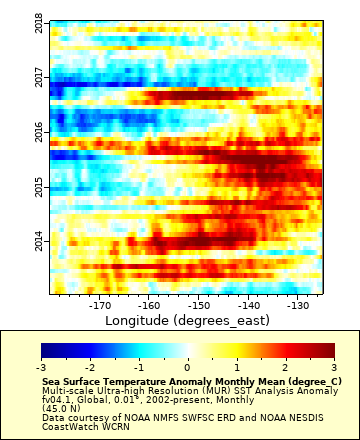
ERDDAP Basics - Creating a Hovmoller plot
This tutorial uses ERDDAP to examine the North Pacific marine heatwave known as the Blob by visualizing sea surface temperature and temperature anomalies over space and time. You will learn how to generate maps, extract time series at a specific location, and create Hovmöller diagrams to track the evolution and movement of the heatwave. The exercise demonstrates how ERDDAP can be used to explore long-term ocean variability using reproducible, URL-based workflows.
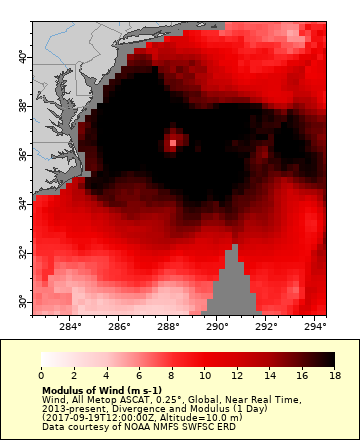
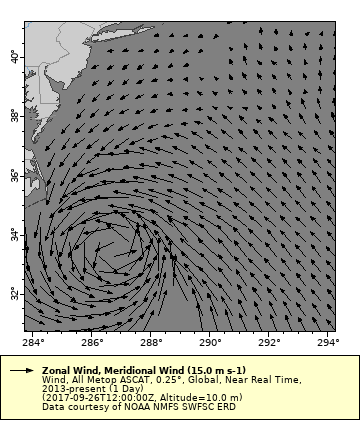
ERDDAP Basics - Work with wind vectors
This tutorial demonstrates how ERDDAP can be used to visualize and analyze hurricane events using satellite-derived ocean surface winds from the ASCAT instruments. You will learn how to map both scalar wind speed and vector wind fields to identify storm structure, intensity, and circulation patterns during Hurricane Jose in September 2017. The exercise highlights ERDDAP’s ability to work with gridded wind data for mapping, vector visualization, and time-evolving analysis of extreme weather events.
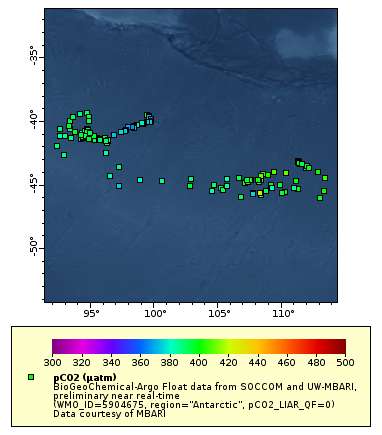
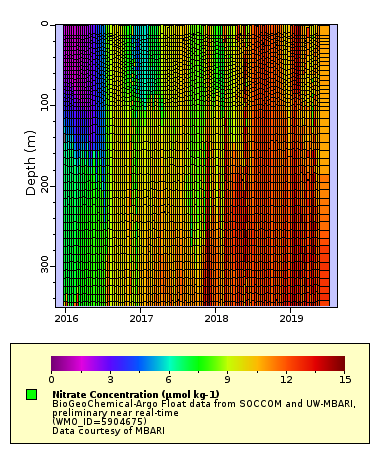
ERDDAP Basics - Using tabular data
This tutorial introduces ERDDAP tabular datasets using Biogeochemical-Argo (BGC-Argo) float data hosted on the PolarWatch ERDDAP server. You will learn how to subset observations using constraints, filter data by quality flags and regions, and visualize float locations, trajectories, and depth profiles. The exercise highlights how ERDDAP supports interactive exploration of in-situ oceanographic data alongside gridded satellite products.
ERDDAP Basics - Additional Resources
This page provides links to supplemental training materials and courses offered through NOAA CoastWatch and its regional nodes. Resources include R-based exercises from the NOAA CoastWatch West Coast Node that demonstrate how to extract and analyze ERDDAP data for applied fisheries and oceanographic research. Also included are CoastWatch satellite data courses designed to help scientists and managers incorporate satellite products into their operational workflows.
Setting up a Python environment
This tutorial walks you through setting up and testing a Python environment for use with the CoastWatch Satellite Course. You will learn how to install Python and Conda, create a dedicated coastwatch Conda environment using a provided configuration file, and verify that all required packages are installed. The tutorial also shows how to launch JupyterLab to run and explore the course’s Python notebook tutorials
Troubleshooting rerrdapXtracto
This page walks through the most common errors encountered when using the rerddapXtracto R package and explains how to interpret and resolve them. Using real error messages and worked examples, it covers issues such as missing datasets, parameter name changes, coordinate and dimension mismatches, out-of-bounds requests, NA values, and oversized data queries. The goal is to help users quickly diagnose problems, understand what the error messages are telling them, and adjust their ERDDAP requests with confidence.
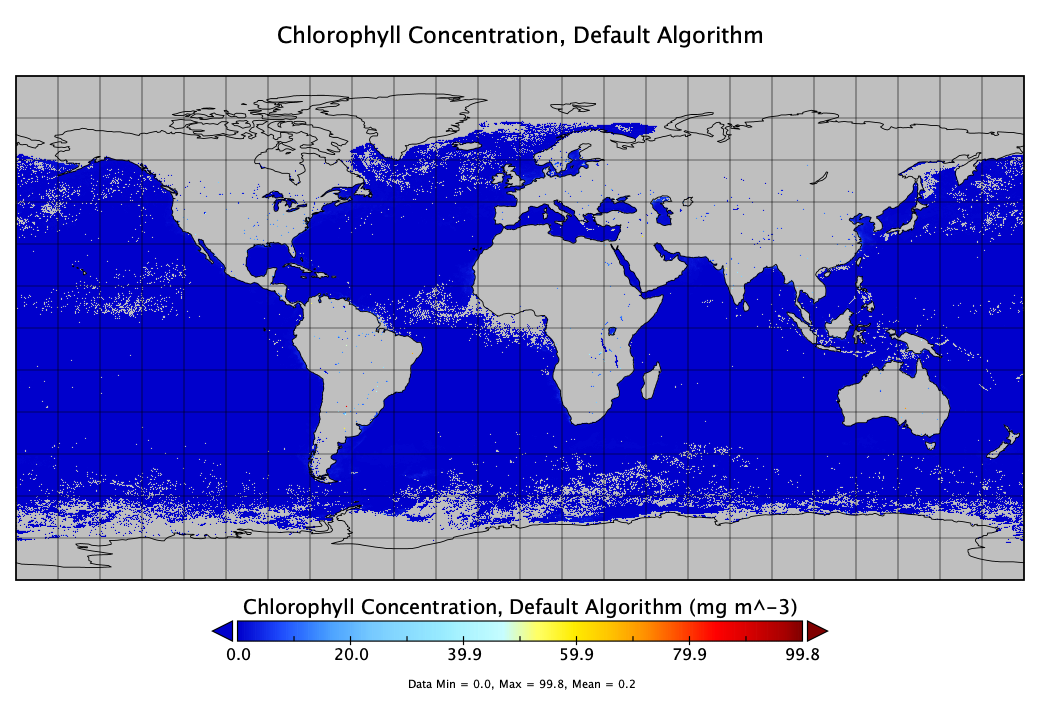
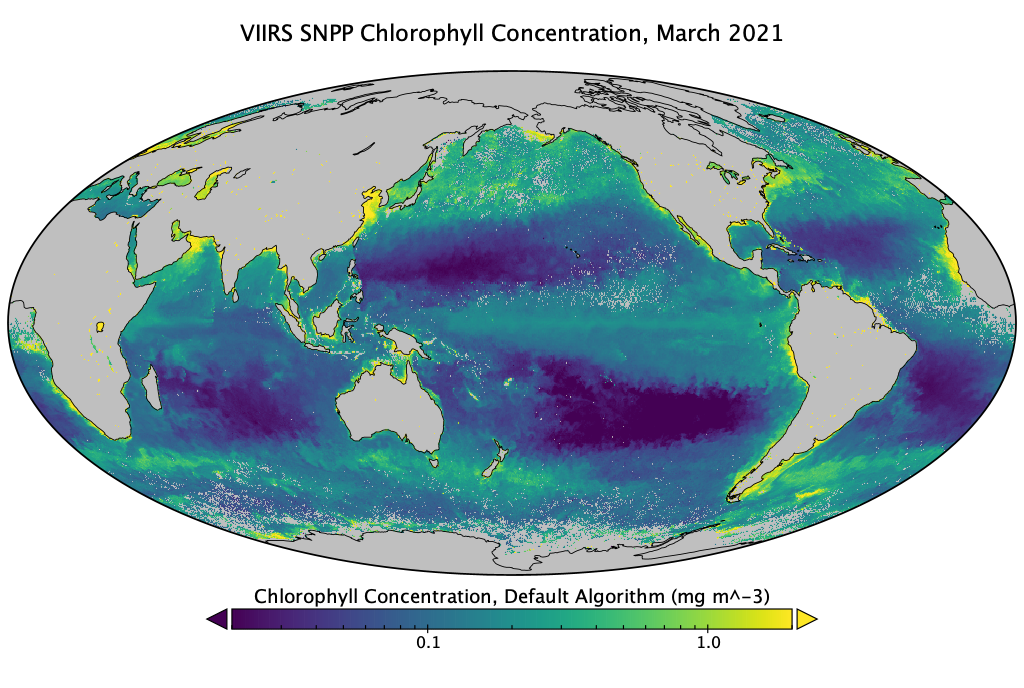
NetCDF and Panoply Tutorial
This tutorial introduces the NetCDF data format and demonstrates how to explore, visualize, and interpret multidimensional satellite datasets using NASA’s Panoply viewer. It explains the structure and metadata of NetCDF files and walks through hands-on examples for mapping chlorophyll, sea surface temperature, and wind speed, including adjusting color scales, projections, and time steps. The tutorial is designed to help users become comfortable opening NetCDF files, understanding their contents, and creating publication-ready visualizations without writing code.
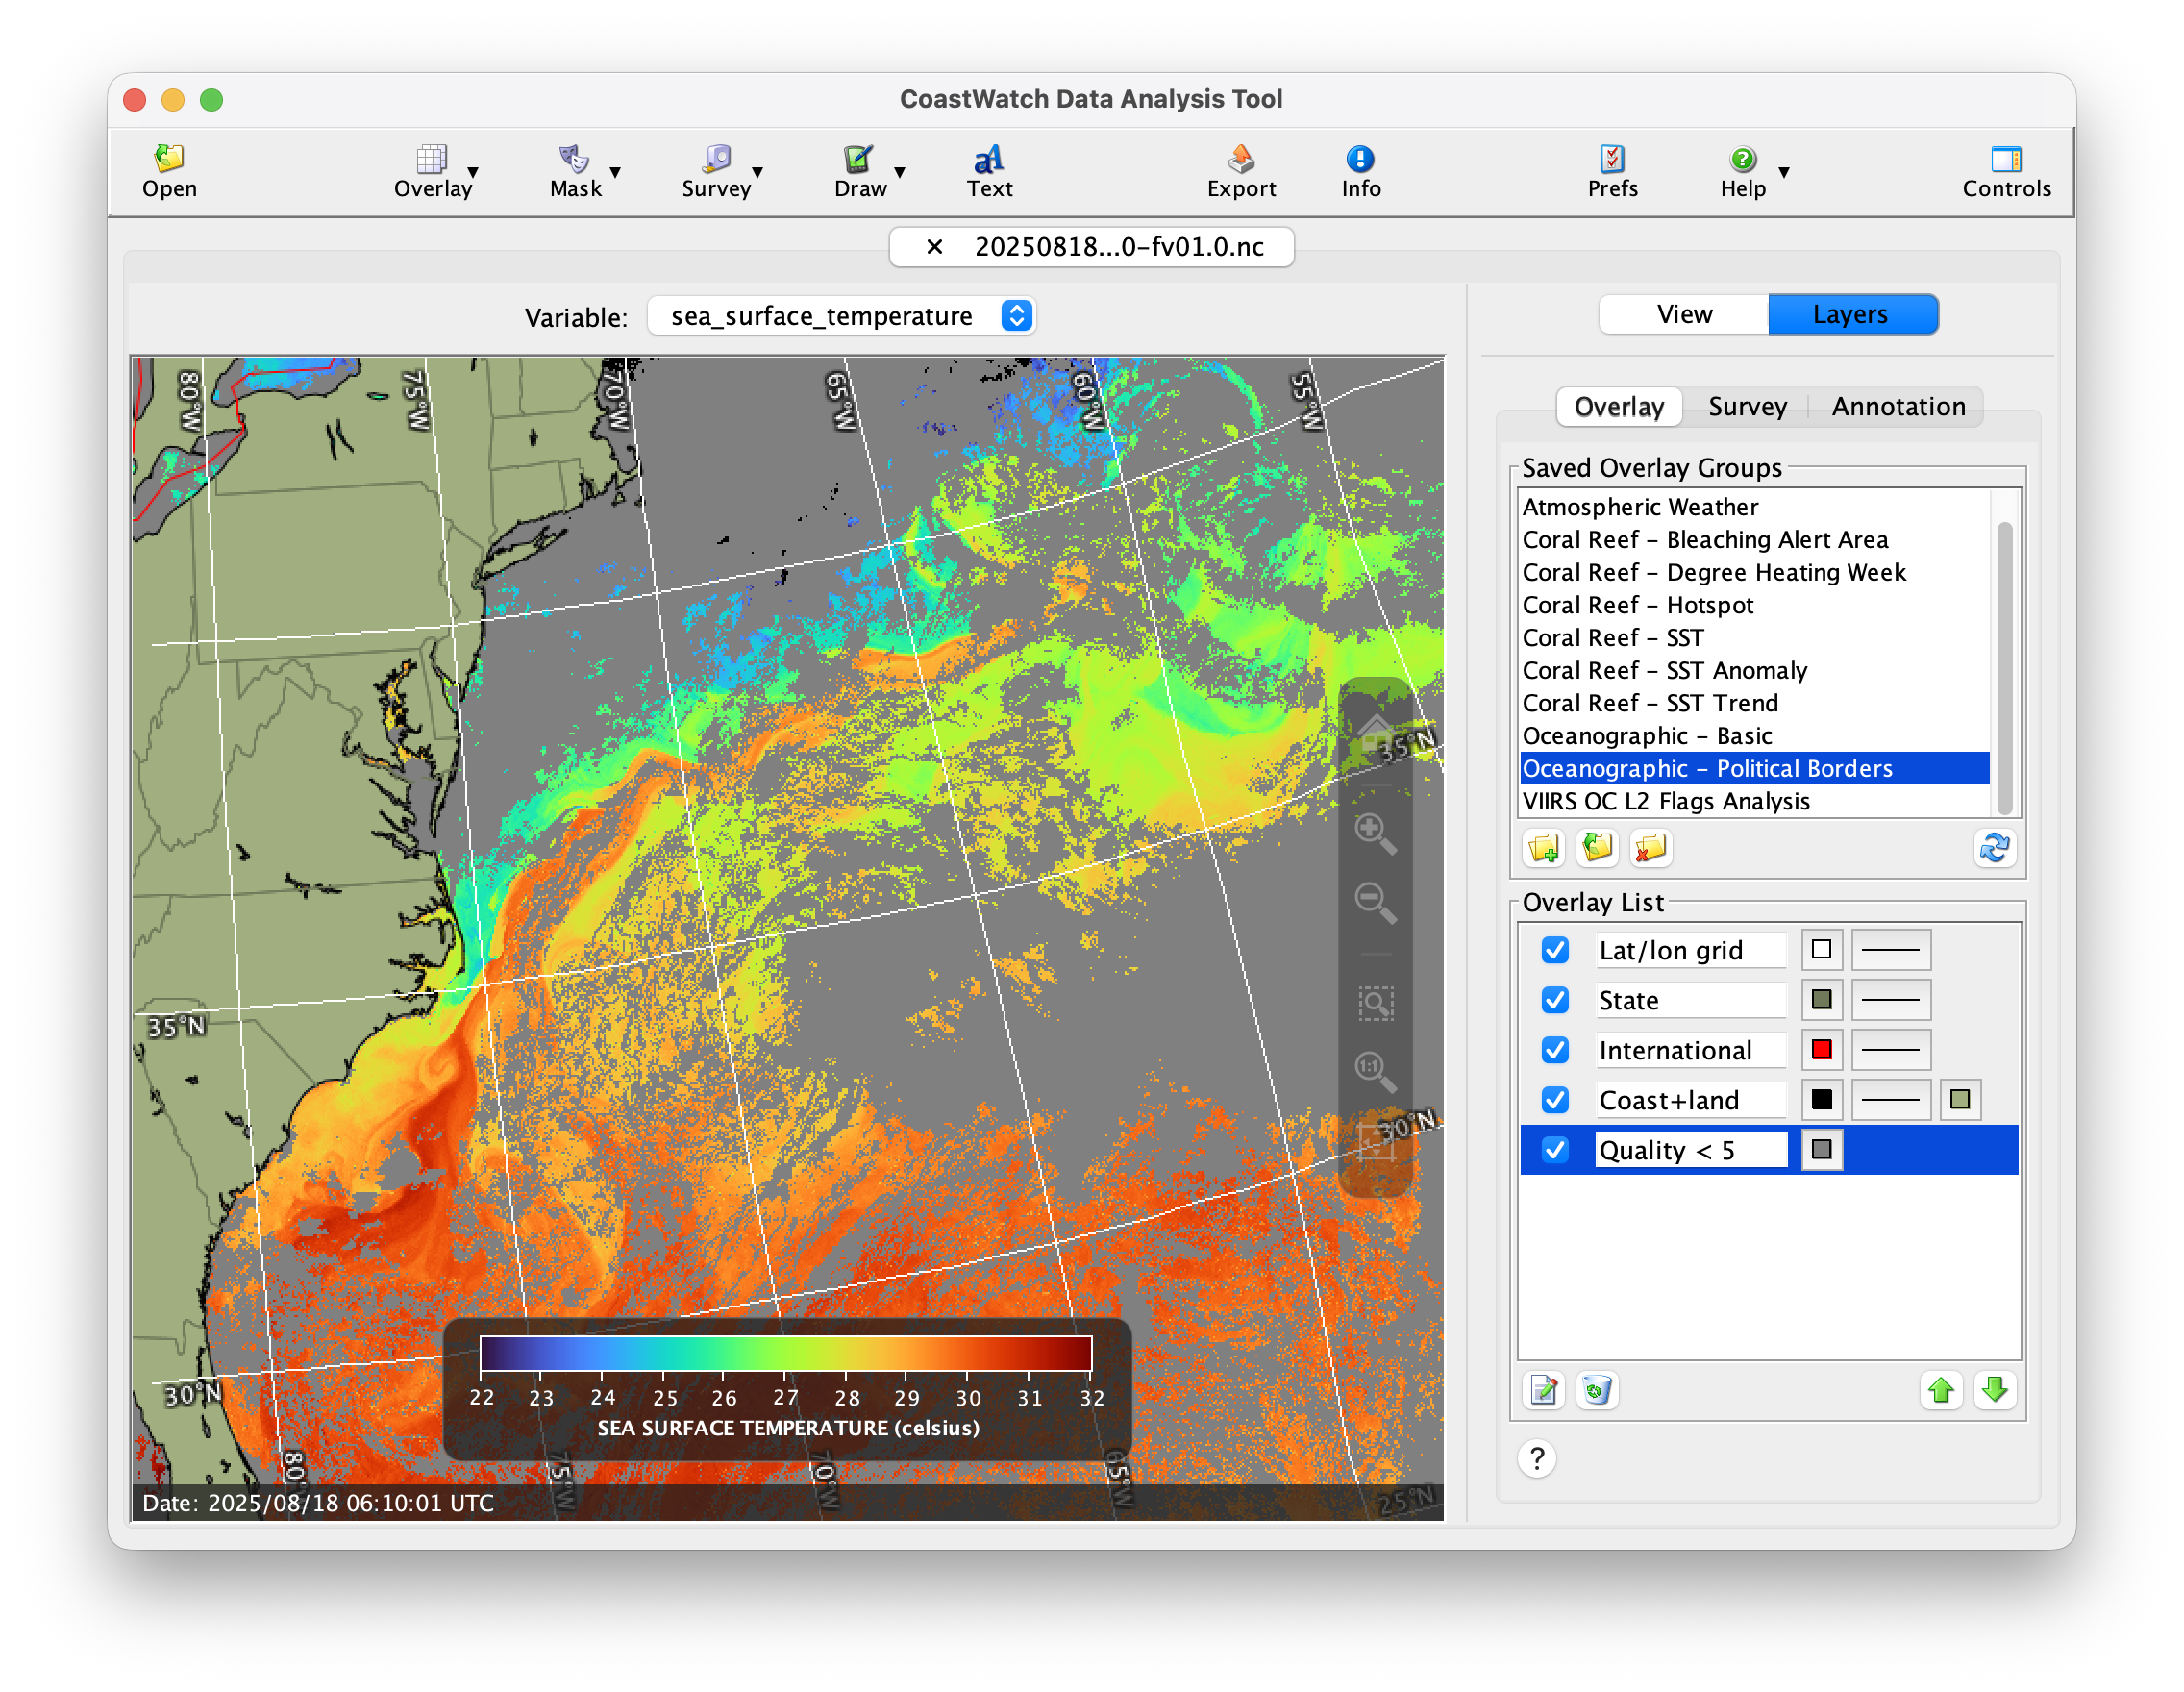
CoastWatch Utilities
This online course provides comprehensive training on the CoastWatch Utilities software package for processing and analyzing satellite imagery and derived oceanographic data. Through a series of self-paced units, the course covers both graphical and command-line workflows for inspecting data files, visualizing variables, extracting statistics, creating composites, and automating data processing—no programming experience required. The material includes hands-on exercises, sample datasets, quizzes, and assignments, making it a complete resource for learning how to work efficiently with CoastWatch NetCDF and HDF data products across Windows, Mac, and Linux systems.