Data Overlays
CDAT shows graphics in the data view using overlays, which are layered on top of the data image. To show a latitude/longitude grid, coastlines, and to mask low quality SST data, do the following:
- Click the
 Overlay button in the toolbar, then
  Coastlines to add a coastlines overlay.
 - Again using the Overlay button, click
 Latitude / longitude grid to add a grid overlay.
 - Click the
 Mask button in the toolbar, and then
  Expression mask. An overlay properties window will appear — type quality_level < 5 in the mask expression text field, then click OK. The quality_level variable contains a rating value for the SST pixels on a scale from 1 (lowest quality) to 5 (highest quality). The expression masks out any pixels with a quality rating less than 5.
![]() NOTE: Step 3 above will only work if you selected the quality_level variable when opening the file. If you get an error clicking OK on Step 3, close and reopen the file and select both the sea_surface_temperature and quality_level variables.
NOTE: Step 3 above will only work if you selected the quality_level variable when opening the file. If you get an error clicking OK on Step 3, close and reopen the file and select both the sea_surface_temperature and quality_level variables.
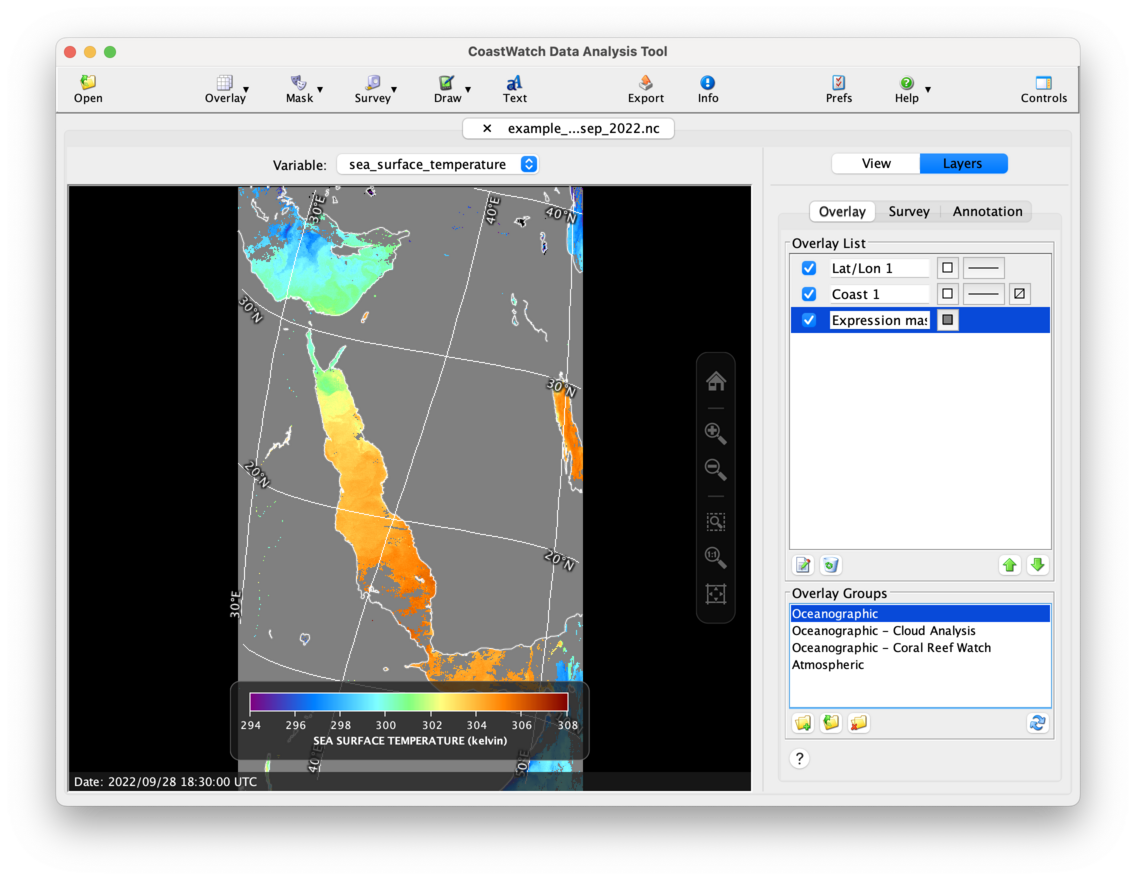
Your CDAT window will look similar to the following (notice that the control tabs were automatically updated to show the new overlay layers):

The data view is more useful now but doesn’t look correct. The mask data is rendering on top of the coast and grid lines. The Overlay list shows the overlay layers as if they’re a stack, rendered from bottom to top. Try rearranging the overlays by selecting an overlay (click on its right side) and use the ![]() Move Up and
Move Up and ![]() Move Down buttons to rearrange the overlays until the CDAT window looks as follows:
Move Down buttons to rearrange the overlays until the CDAT window looks as follows:
 Bonus exercises:
- Try changing the overlays’ drawing color, line style, or fill color. You can also change the name to help you remember the overlay contents, ie: Quality mask instead of Expression mask 1.
- Double-click on the right of the overlay in the list to reveal a properties window with other properties to change. You can also select an overlay and click the
 Edit button.
 - Try deleting all the overlays in the list using the
 Remove button. Now, double-click the Oceanographic overlay group in the Overlay Groups panel. The Overlay List now contains some useful overlays (but not a quality mask, though you could add one in the same way as Step 3 above).
 - Watch a YouTube video on data overlays.