Shape Overlays
A shape overlay displays line and polygon data stored in ESRI shapefile format with a geographic WGS 84 projection. Shapefile data is freely available from many GIS data websites. For this exercise we’ll use the example_altim_surface_curr_feb_2023.nc data file and overlay the Hexagon_50km_length.shp shapefile, a hexagonal grid created for the Gulf of Mexico.
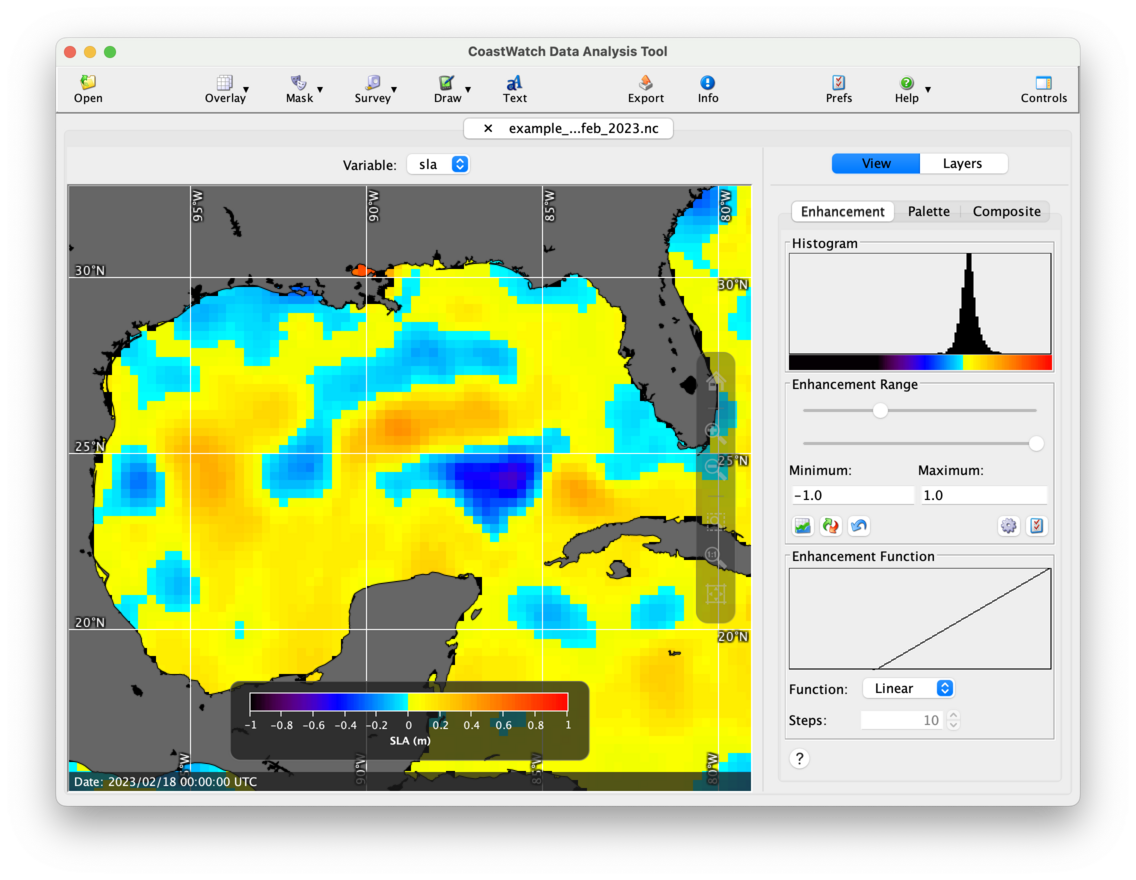
Start by opening the data file and loading the sla variable. Change the palette to CRW_SSTANOMALY and the range from -1.0 to 1.0. Then add coastlines, lat/lon lines, and zoom in to the Gulf of Mexico. The data view should look similar to the following:
To add the hexagonal grid shape overlay:
- Click the
 Overlay button in the toolbar, then
  Shape files — a file chooser window will appear and you can manually navigate to the shapefile, or drag it into the chooser window.
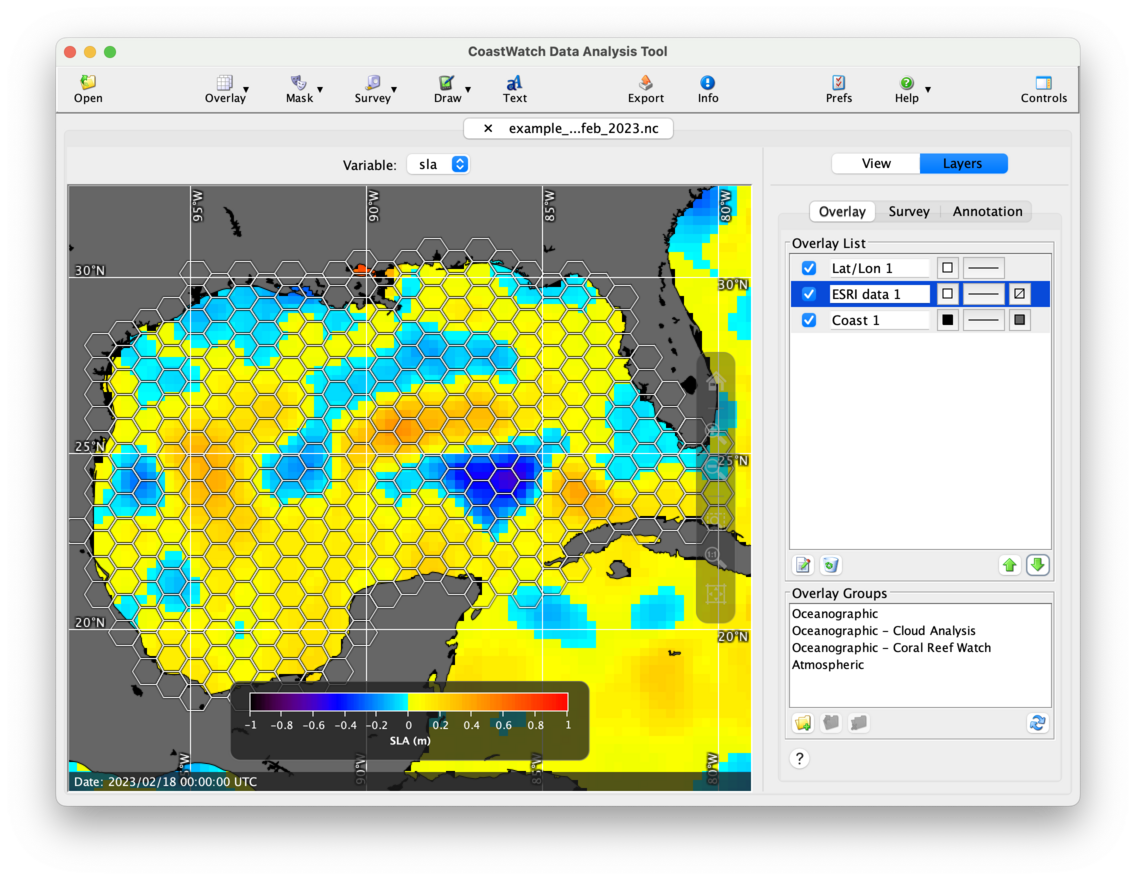
 - Select the new ESRI data 1 overlay and edit the properties to draw line drop shadows. This helps highlight the white lines on a light background.
- Move the new shape overlay to the middle of the list between the coast and lat/lon overlay using the
 Move Down button. That way the shape lines render on top of the land polygons.
You should now see a data view similar to the following:
 Bonus exercises:
- Try loading your own shapefile data from one of the free online data sources.
- Edit the properties of the shape overlay, and add a Fill color and a Transparency value.