Navigating Within the Data View
You can navigate within the data view using the navigation buttons built into the data view. Use ![]() Zoom to selection (click and drag),
Zoom to selection (click and drag), ![]() Zoom in, or
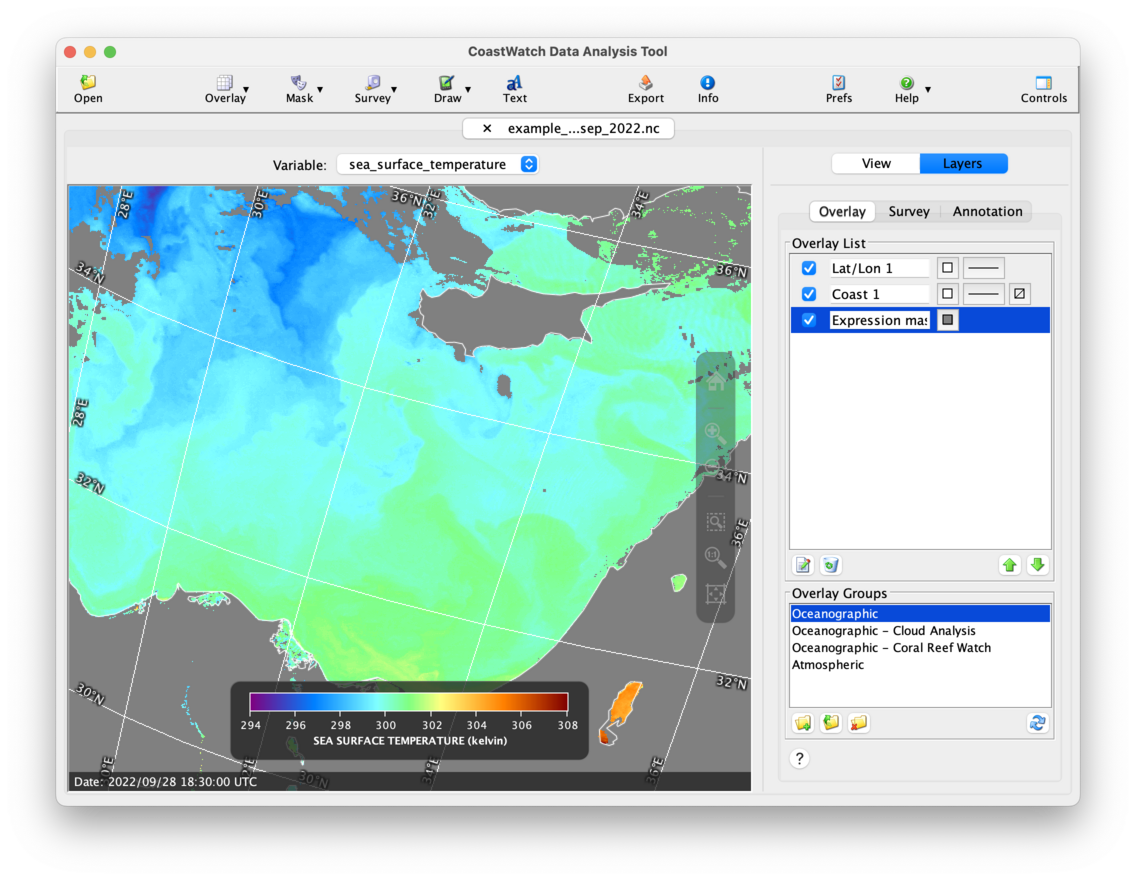
Zoom in, or ![]() Zoom to actual size to magnify the data view. Try zooming in on the Eastern Mediterranean Sea:
Zoom to actual size to magnify the data view. Try zooming in on the Eastern Mediterranean Sea:
Try panning to the northwest by dragging on the data view: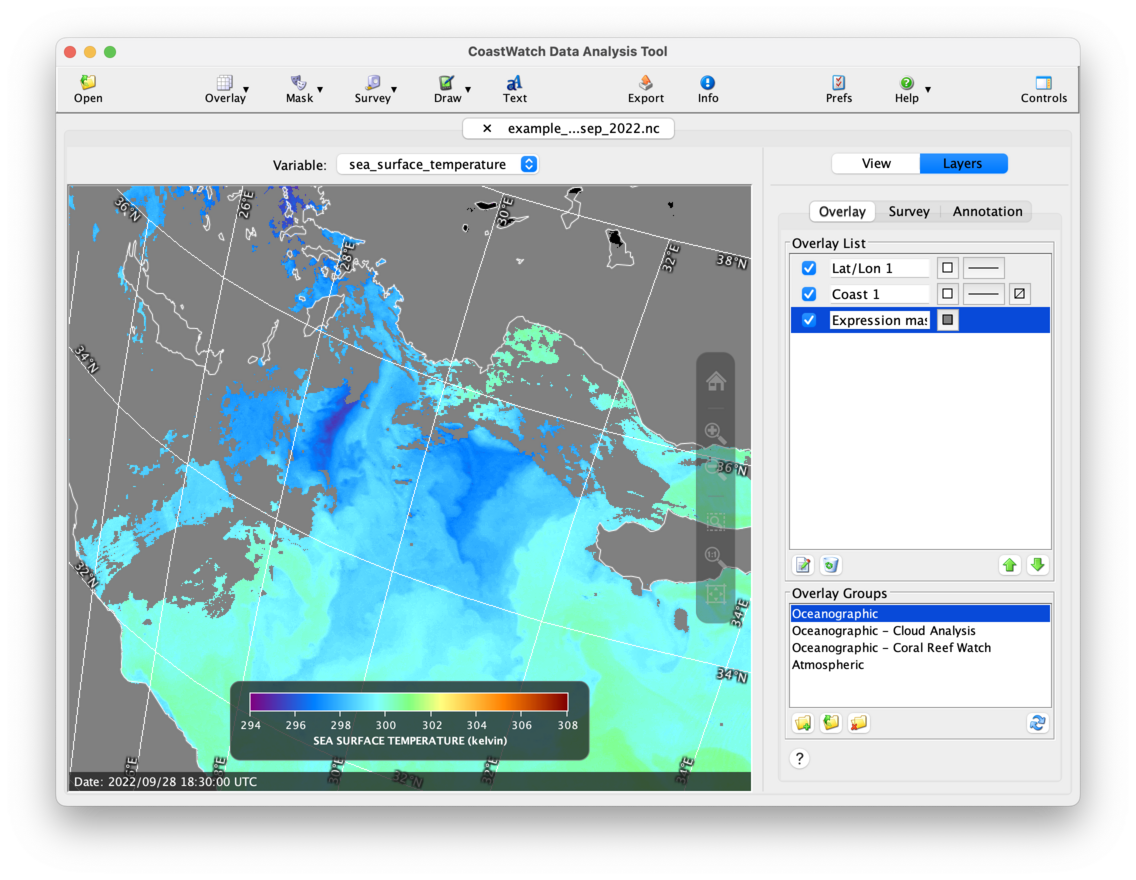
Use ![]() Zoom out,
Zoom out, ![]() Fill window, or
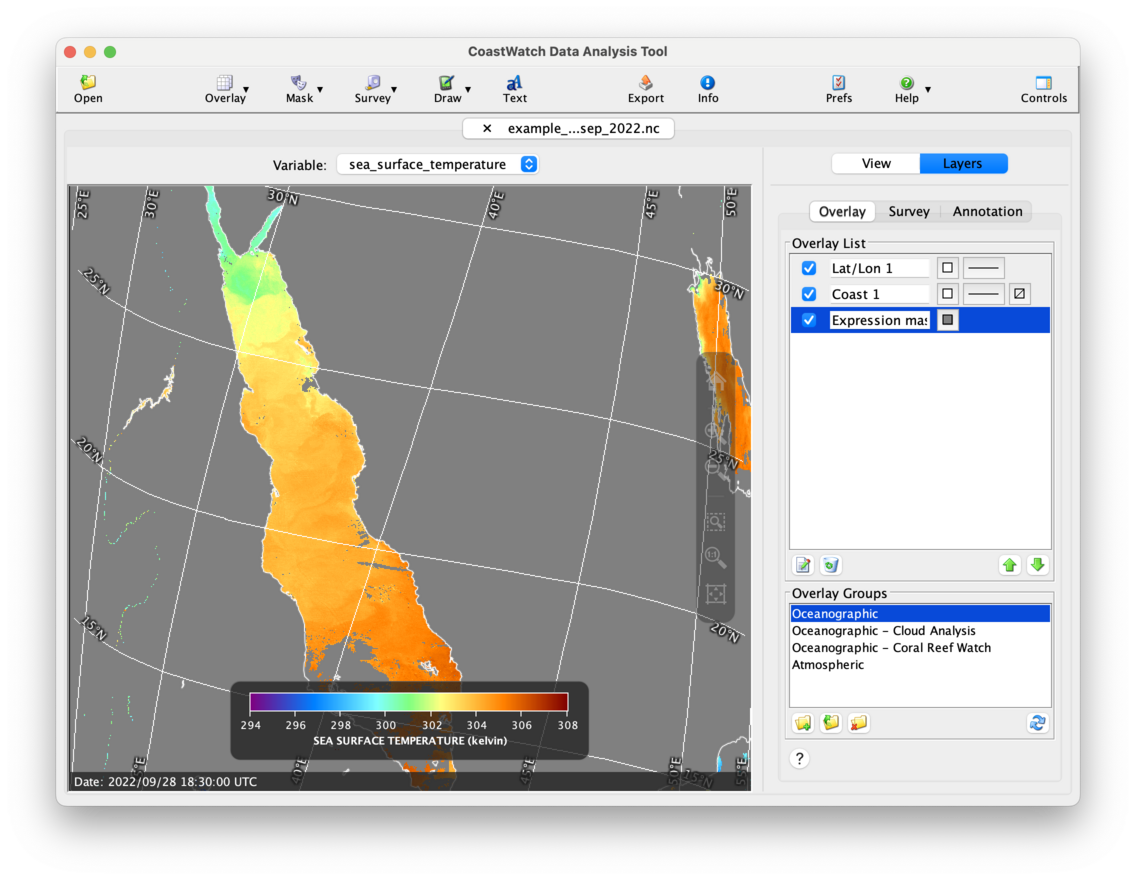
Fill window, or ![]() Fit image to window to zoom back out. Try filling the data view window:
Fit image to window to zoom back out. Try filling the data view window:
 Bonus exercises:
- Try using Full Screen Mode accessed from the View menu, and use the controls to zoom and pan around the data view. Click the X at the top left to exit full screen mode.
- Try changing the data view size either by dragging on the CDAT window edges, or you can use the Window size options in the View menu. This helps keep the view size the same to more easily export and compare images.
- Watch a YouTube video on basic CDAT components and navigating around in the data view (the YouTube video covers an older version with slightly different view navigation controls).