Automated Data Processing
Data files obtained from a data provider such as CoastWatch need one of more tools run on them to produce results useful to you. To automate that task, it’s common to use a script. All the tools presented in this unit and Unit 3 - Command Line Tools for Extracting File Information can be run from a Unix script or Windows batch file:
- cwcomposite - Combines a time series of earth data
- cwcoverage - Creates a geographic coverage map for earth data sets and ground stations
- cwexport - Translates earth data into external formats
- cwimport - Translates earth data into CoastWatch HDF format
- cwinfo - Dumps earth data information in a display-friendly format
- cwmaster - Creates map projection master datasets interactively
- cwmath - Combines earth data using a mathematical expression
- cwregister2 - Resamples earth data using high accuracy algorithms (replaces cwregister)
- cwrender - Performs earth data visualization
- cwsample - Extracts data values at specified earth locations
- cwscript - Runs a script written in BeanShell (beanshell.org)
- cwstats - Calculates statistics for variables in an earth data file
- hdatt - Reads or writes HDF file attributes
As a possible real-world scenario, suppose that a fictitious aquaculture company wants to supplement their ocean enclosure monitoring with satellite observations. They need a daily custom sea surface temperature (SST) image with:
- Enclosure locations marked to identify any oceanographic features that may adversely affect their stock
- Geographic information for reference such as lat/lon graticule lines, depth contours, and coastlines
- Temperatures in their preferred units (Celsius or Fahrenheit)
- A file format that can easily be emailed to the on-site managers
Suppose that a script to perform these steps starts with level 2 SST data files, and outputs a PDF file for the managers. The script would use the command line tools as follows:
- Register the data files to a common master projection template (cwregister2)
- Mask out any low quality data values (cwmath)
- Composite the data to create a large area mosaic (cwcomposite)
- Render the data to a PDF file (cwrender)
The following script is an example of these steps, written in Unix shell (a Windows batch file is also provided in the sample data ZIP file):
#!/bin/sh
###
# These parameters can be customized for the script.
#
master=Aquaculture_region.hdf
shapes=Aquaculture_polygons.shp
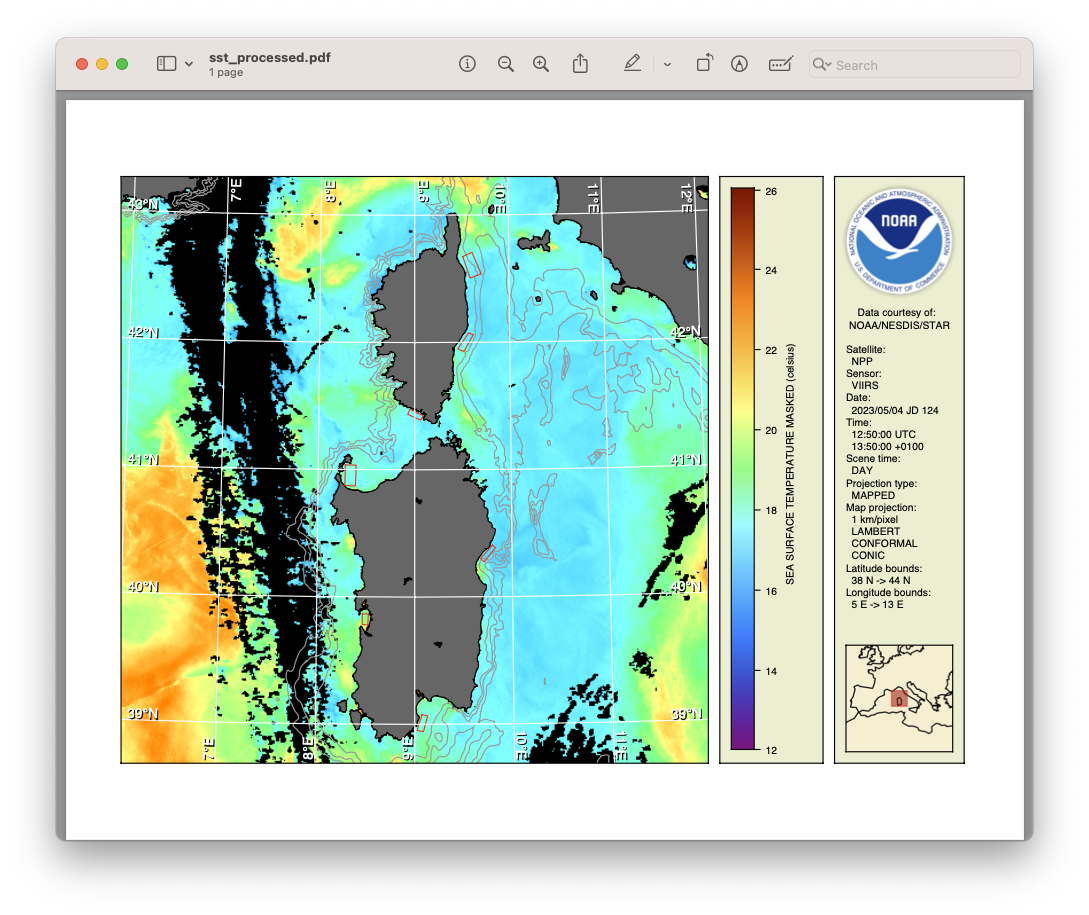
output=sst_processed.pdf
var=sea_surface_temperature
quality=quality_level
units=celsius
range=12/26
palette=HSL256
depths=200/500/1000
###
# Start the data processing
#
inputs="$@"
rm -f reg_*.hdf
n=1
for input in $inputs ; do
echo "Working on input file $n"
echo ".. Registering"
cwregister2 --master $master --match "($var|$quality)" $input reg_$n.hdf
echo ".. Masking"
cwmath --template $var --expr "${var}_masked = $quality < 5 ? NaN : $var" reg_$n.hdf
n=`expr $n + 1`
done
echo "Compositing data files"
rm -f composite.hdf
cwcomposite --method latest --match ${var}_masked reg_*.hdf composite.hdf
echo "Creating output $output"
rm -f $output
cwrender --coast black/gray40 --grid white --shape $shapes/red \
--bath gray60/$depths --enhance ${var}_masked --palette $palette \
--units $units --range $range composite.hdf $outputYou can run the script as follows using the example SST data file from the Visible Infrared Imaging Radiometer Suite (VIIRS) sensor:
./sst_process.sh example_viirs_swath_sst_apr_2023.nc
This example runs using a single input data file but the script is written to accept multiple files. Your script should run and produce a PDF file that looks like the following (the small red boxes mark the enclosures):
 Bonus exercises:
- Customize the SST processing script to produce a different output file format with your own preferred set of geographic overlays. The cwrender manual page will be useful.
- Use cwmaster to create your own master projection template and use that in the script instead of the one provided.
- Use your own ESRI shapefile data for the aquaculture enclosure polygons. You could create a custom shapefile visually using the geojson.io tool.
- Watch a YouTube video showing the use of a script that composites and renders a year of chlorophyll data.