Topographic and Bathymetric Contours
You can add topographic and bathymetric contour lines to the data view using a topography overlay. Contours are computed on-the-fly from a built-in data file containing ETOPO 5-minute resolution elevation data. In this exercise we’ll use the ocean currents data file example_altim_surface_curr_feb_2023.nc and render sea level anomaly with bathymetric contours.
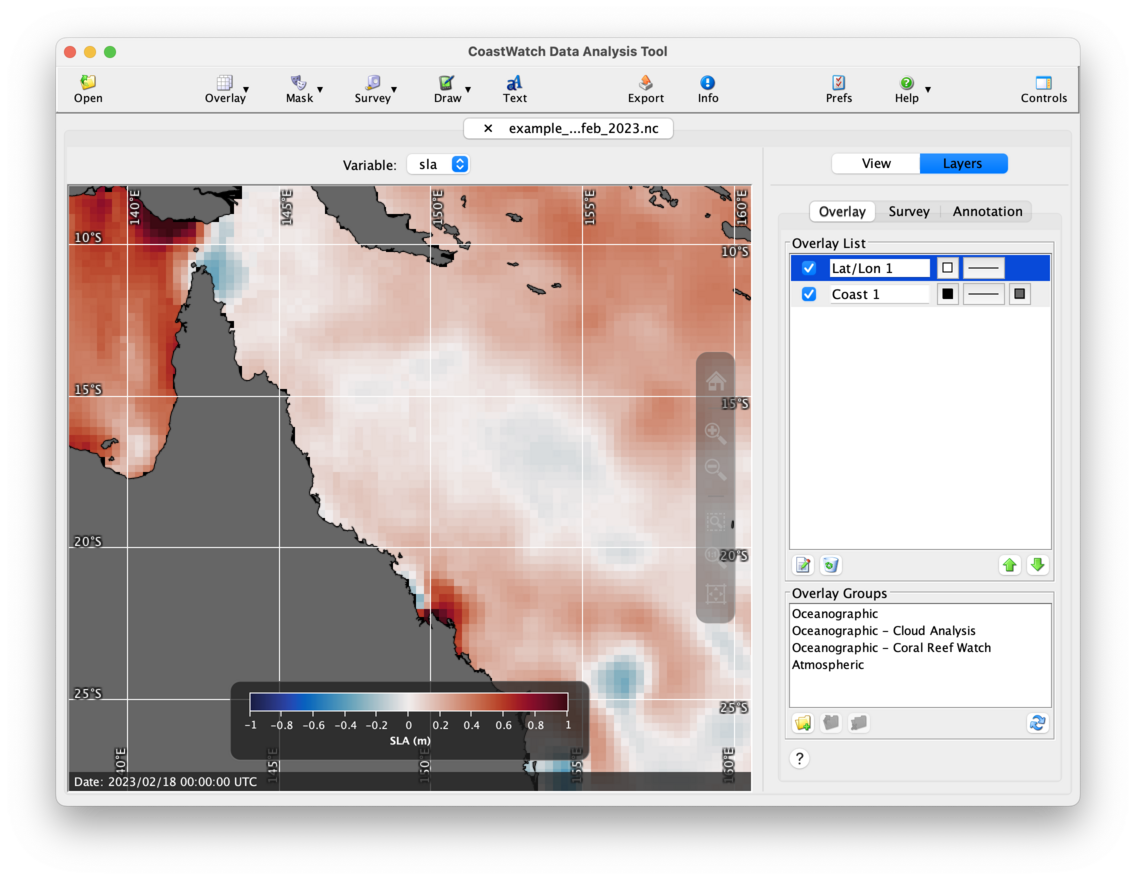
Start by opening the data file and loading the sla variable. Change the palette to Ocean-balance and the range from -1.0 to 1.0. Then add coastlines, lat/lon lines, and zoom in to northeastern Australia. The data view should look similar to the following:
To add and edit a topography overlay, do the following:
- Click the
 Overlay button in the toolbar, then
  Topographic and bathymetric contours. By default a topography overlay with 200 m and 2000 m depth contours is created.
 - Select the new Topography 1 overlay in the Overlay List and click the
 Edit button — an overlay properties window will appear.
 - Turn on the Draw line drop shadow check box.
- Remove the -200 and -2000 entries in the list by selecting them and using the
 Remove button.
 - Add contours for -500, -200, -100, 100, 200, and 500 using the text field under the Levels list. You can type each one and hit the Enter key or click the
 Add button.
 - Click OK to accept all the changes.
- Move the new topography overlay to the middle of the list between the coast and lat/lon overlay using the
 Move Down button. That way the topography lines render on top of the land polygons.
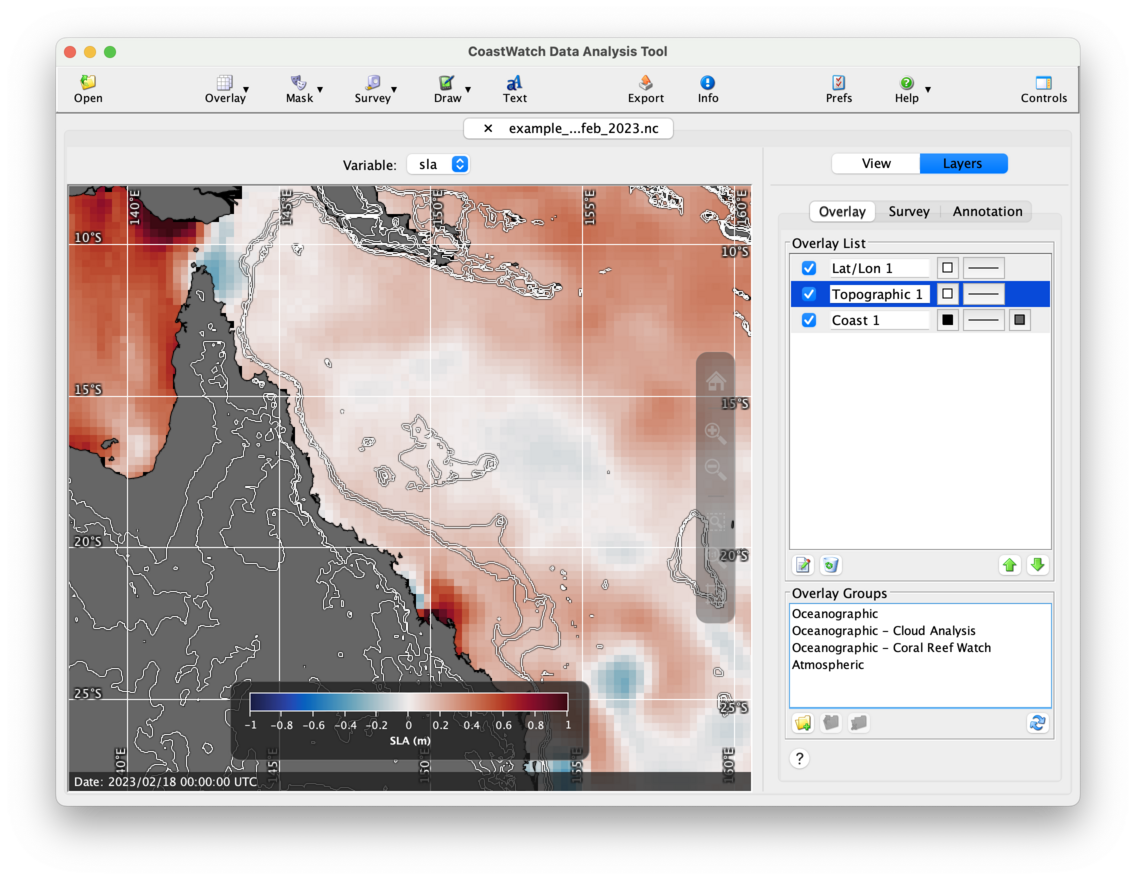
You should now see a data view similar to the following:
![]() NOTE: Use caution with rendering topography overlays in a large area such as a global data view. It’s best to avoid this because it can take a significant time for CDAT to create and render many contours over such a large area, and can also fail to render properly.
NOTE: Use caution with rendering topography overlays in a large area such as a global data view. It’s best to avoid this because it can take a significant time for CDAT to create and render many contours over such a large area, and can also fail to render properly.
 Bonus exercises:
- Try opening another data file and adding a topography overlay for your own area of interest.
- View topographic elevation data directly by opening the ETOPO data file in your CoastWatch Utilities installation directory
<INSTALLDIR>/data/noaa/coastwatch/render/etopo5.hdf. - As of version 4.0.0 of the CoastWatch Utilities, a 1 km ETOPO data file is also availalble from the CoastWatch Utilities distribution page under the Data Tools section of the CoastWatch central operations website.
- Search online for other sources of topographic contour data that you can use in the next exercise on shape overlays.