Spatial and Temporal Composites (cwcomposite)
The cwcomposite tool combines data variables across multiple data files by computing a value at each pixel: mean, median, minimum, maximum, or latest value. There are generally two scenarios for using cwcomposite:
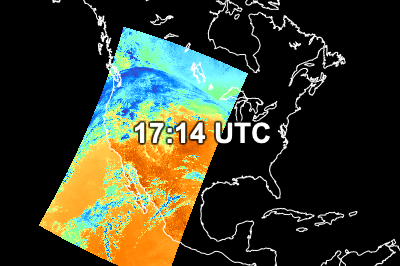
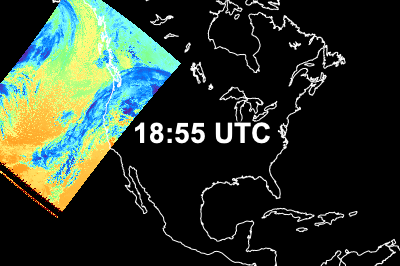
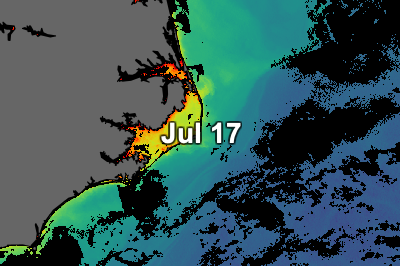
Case 1 - Spatial composite over a short time period (~ 1 day):
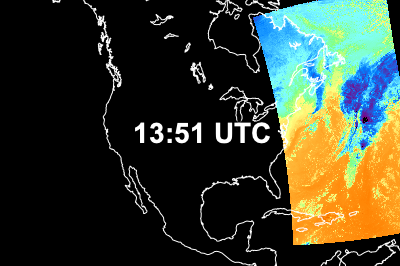
|
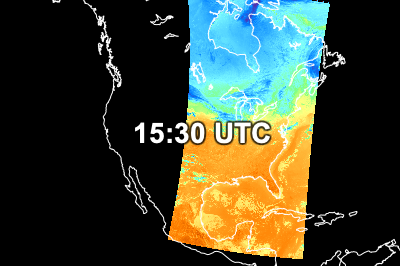
|
Spatial composite result: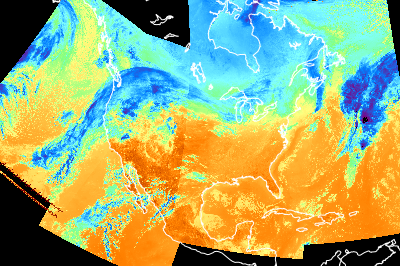
|
|
|
|
||
Case 2 - Temporal composite over a longer time period (days/weeks/months):
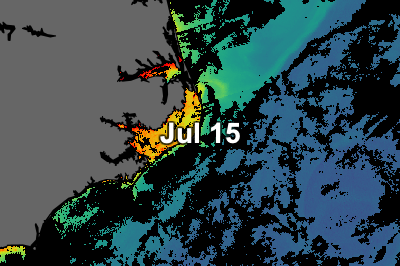
|
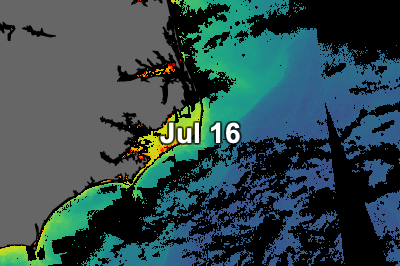
|
Temporal composite result: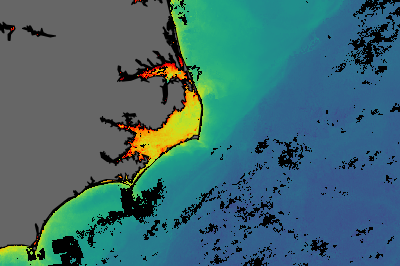
|
|
|

|
||
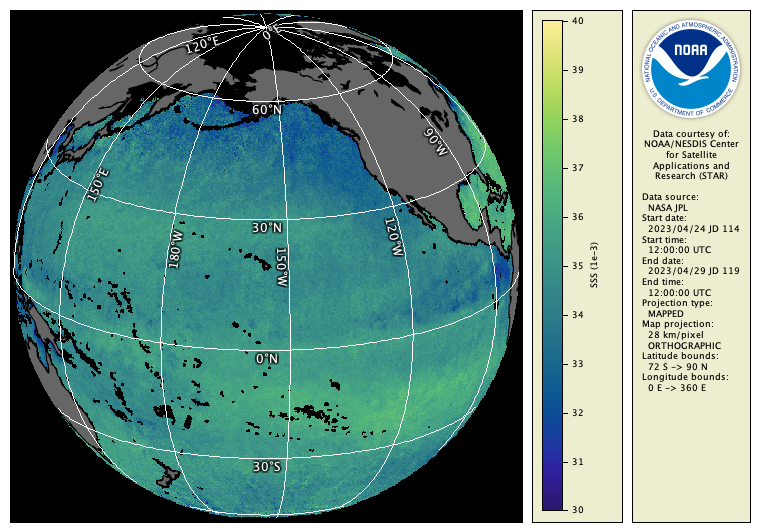
Type the following command to create a 7-day composite from daily SMAP sea surface salinity data:
cwcomposite -v --match sss example_smap_salinity_apr_*.nc example_smap_salinity_apr_7day.hdf
You should see the composite running in verbose mode as follows:
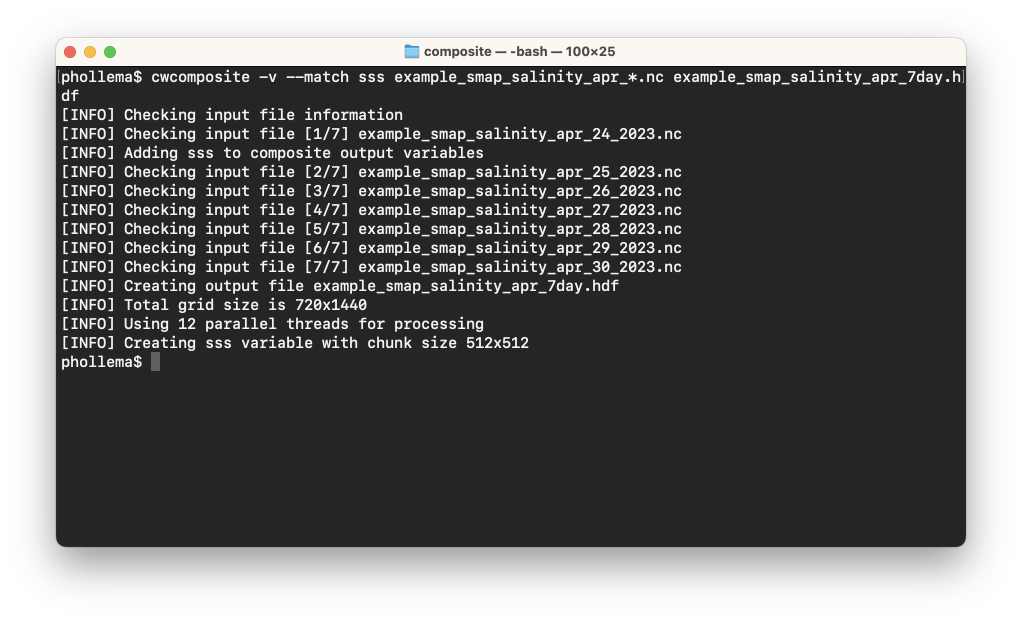
The default for cwcomposite is to compute the mean value at each pixel — other composite methods are set using the --method option. You can view the output file in CDAT, or render it as follows:
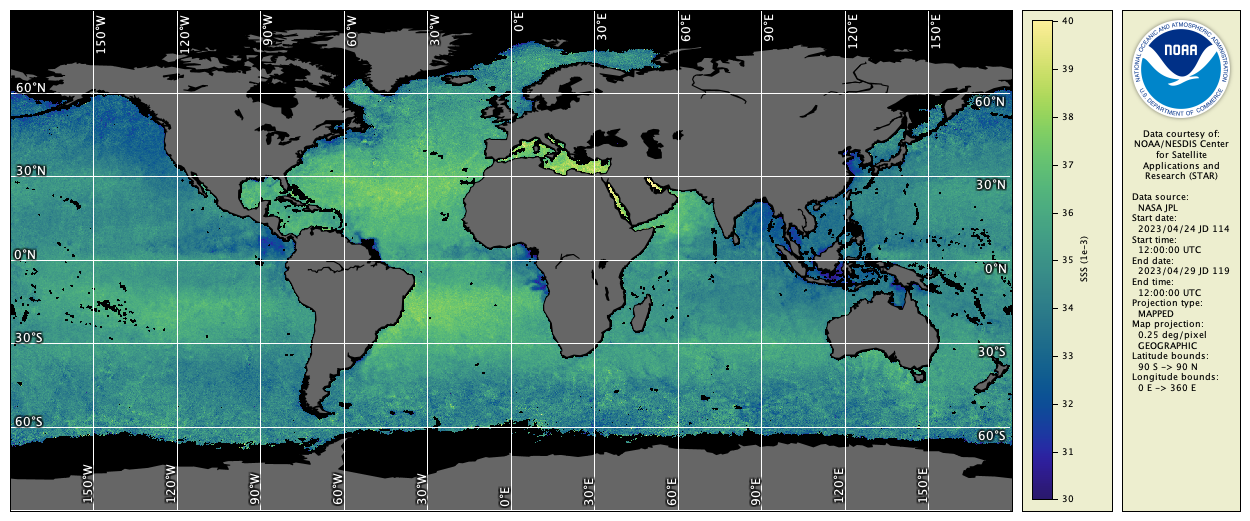
cwrender --enhance sss --range 30/40 --palette Ocean-haline --grid white --coast black/gray40 example_smap_salinity_apr_7day.hdf example_smap_salinity_apr_7day.png
You should see the following image:
 Bonus exercises:
- Read the cwcomposite Unix man page or user’s guide section.
- Add an option to the cwcomposite command line to compute the minimum value at each pixel.
- Find out how to make cwcomposite mark a pixel invalid if the number of valid input values at the pixel is less than 5.
- Suppose a researcher asked for an uninterrupted image of the Pacific Ocean. Try using cwmaster and cwregister2 from the previous exercises to create one, for example: